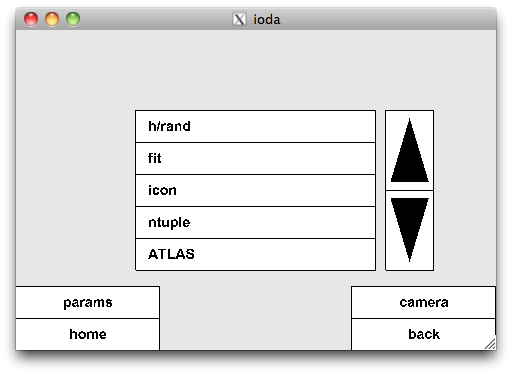
Since 1.2, ioda can read ntuple (defined as a table of columns with numbers) stored at various file formats as a "flat TTree" in a CERN-ROOT file, a BINARY_TABLE in a FITS file, a flat ntuple in an AIDA file and table data in a CSV file.
When a ntuple is recognized, ioda presents the labels of the ntuple columns in order to do interactive projections of one or two columns in a 1D or 2D histogram. The plot resulting from a ntuple projection is equipped with sliders that permit to change the histogram booking interactively. Below we show a projection session done over the demo.root file coming with the distribution.
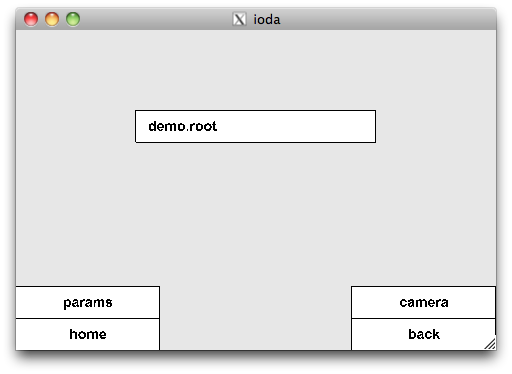
demo.root
Go under examples, then ntuple and select "demo.root" :
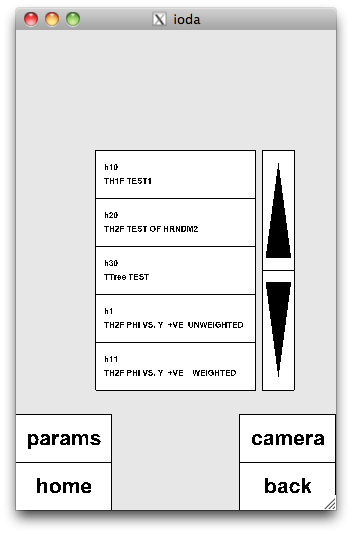
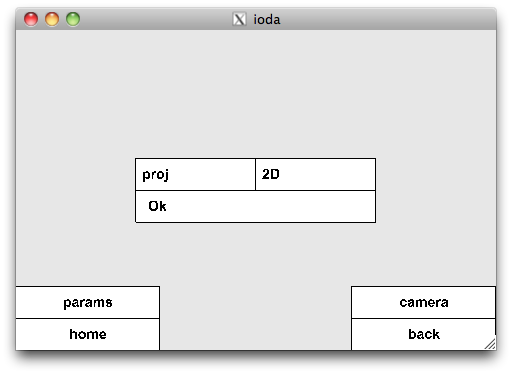
Then choose "h30/TTree TEST". The "proj" menu is presented. Click "1D" to change it to "2D" :
Change the "Y bind" to "Z" :
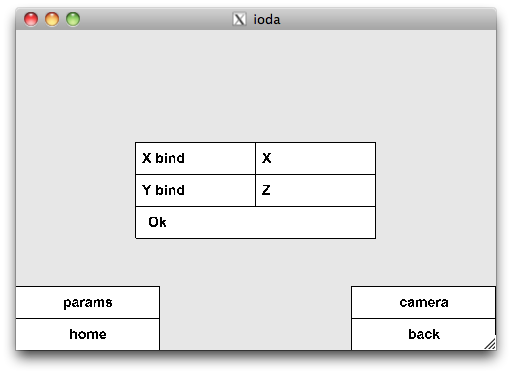
Then a proposed 2D histogram booking is presented :
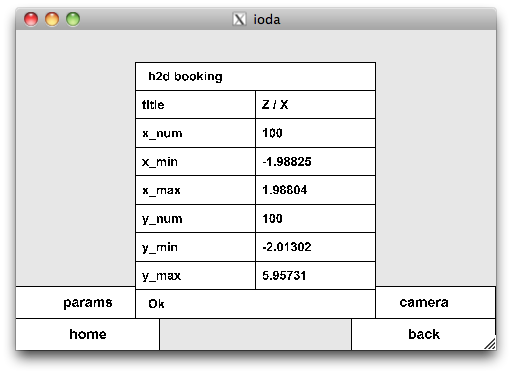
Confirm with "Ok", then you should see the 2D plot :
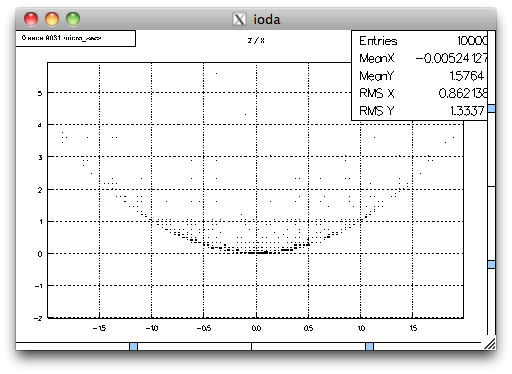
The two bottom blue sliders permit to change the min/max X booking, whilst the two right sliders permit to change the min/max Y booking. The bottom right "H" button permits to hide the sliders. Obviously the responsiveness of the sliders depends of the number of rows of the ntuple...